
Yesterday, I heard the RIVM briefing and then I followed the debate in parliament. And I wondered if they were talking about the Covid-19 virus. So much more is known by research, but at no time did I hear that back yesterday. Really from no one.
In Dutch politics and in the media, the latest research findings play virtually no role. On the one hand this is because so little research is done in the Netherlands itself, while on the other hand, research from abroad is hardly picked up in the Netherlands. Not even if it is carried out a stone’s throw away from our borders.
If you do follow those studies, then the discussions within Dutch politics – like yesterday in Parliament – and the interviews with experts in talk shows, to put it very kindly, are astonishing. As if it were a totally different virus.
First a few important issues regarding the virus, on which there is now quite some international consensus, and then some recent information:
Transmitting an infection with Covid-19 by touching objects does not happen. I repeat: does not take place.
Everything we do to prevent contamination by touching objects is of no value.
The chance of being infected with Covid-19 in the open air is very, very small. Especially when the sun is shining.
Unfortunately, no contact studies have been published in the Netherlands (they have barely been carried out). So we are investigating the contacts of infected people with those around us. Fortunately, abroad they do. There are studies from China, South Korea, the USA and Germany.
From these, the same picture emerges:
-
Infection takes place through close and prolonged contact within confined spaces, but not through incidental and brief contact. So, if you are close to an infected person for a while (in the first 5 days of his symptoms) then you are most likely to be infected. So, the time factor is important. (The time is not specified in the examinations, but it is more a half hour than 5 minutes).
The image that you get infected because you are near an infected person for a short period of time, from which you “catch” a drop, is completely misplaced.
-
The longer you are in a place where you get the virus, the more severe the symptoms are on average, the sicker you become.
-
Roommates of an infected person do not get infected nearly as often as was thought. Percentages that have been established are between 5 and 25%. The vast majority of household members are not infected. Even those who are infected are usually (much) less sick than if they were infected during a super spreading event.
-
In places where there are many people and the aerosols can remain floating with the virus, many people can be infected at the same time. The time you spend in that room and the number of aerosols with the virus in the air play an important role in the extent to which you become ill. (These are the super spreading events)
-
The effects of aerosols are reduced by good ventilation and a humidity of 6gr/Kg.
-
The exponential growth in the number of infected persons is caused by super spreading events and not by direct contact between an infected person and non-infected persons.
-
The risks of infection are greatest in places where you are in the same room with an infected person for a long time. These include households, public transport, offices and restaurants. Places where many people speak/shout/song are a clear risk that many of those present will become infected.
It would be nice if all those involved in the political and public debate were aware of these international research results. So that discussions can be held in a meaningful way and decisions can be taken on a sound basis. Now it seems that people are not even heading for 50% of the knowledge.
It also prevents many Dutch people from thinking that their chance of being infected is many times higher than it really is. In this way they worry too much and limit their behavior (way) too much.
The second wave
There have been interventions by the authorities, which we couldn’t have imagined until three months ago. However, they have intervened on the basis of very shaky data. And this in cooperation with professionals, who very often use the word “evidence-based”. And the sad thing is, most politicians as well as the media seem to hang on the lips of these experts.
A few examples:
The vague reproduction factors
The so crucial reproduction factor (R0) is not a God given formula that you can apply just like that. Choices have to be made when defining R0. The choices you make influence the outcome.
If you know exactly how many infected people there are per day in the Netherlands, you can easily calculate that figure. But we do not have these figures (which are impossible to obtain). Th amount of testing only provides a small part of them. In the absence of that data, you have to approach it via other methods. But because of that, the R0 is only an indication of what is really happening with the spread of the virus in the population:
· The Corona mortality rates used by the RIVM are based on the mortality of people who had been diagnosed of having Corona. Based on the population registrar, Statistics Netherlands (CBS) determents how many more Dutch people die each week, than the average for that week in recent years. Anything more is called excess mortality and is then assigned to this virus. The CBS count is 2 weeks behind on average. If we then know that on average it takes 3 weeks between becoming infected and dying, the total delay is 5 weeks.
· Assuming the number of people actually found to be infected in the Netherlands (currently more than 45,000), the number found depends entirely on how many people have been tested. If we are going to double the number of tests in the near future, you will find more infected persons.
· If you base yourself on daily hospital admissions, which the RIVM apparently does, then these is another problem: It could well be that, because hospitals are less crowded now, they are less strict when accepting patients. That would mean an increase in the number of hospitalizations without the number of infections in the country increasing.
So, the data is just an approximation of reality with considerable margins of uncertainty.
This was the last presentation of the R0 figure by the RIVM at the session with the Lower House on May 7th.

So, on May 7th the R0 was presented based on the hospital admissions until May 1st. Hospital admissions will take place 10 to 12 days after the infection. So on average there is already a delay of 3 weeks.
To add insult to injury: The RIVM refuses to disclose which values they use in the R0 formula. Plus, they don’t want to disclose what the current values are, as this tweet from a journalist shows:

So, we can’t check how the figure is calculated, and we don’t get to hear the actual values.
A number of German universities show on their website the development of R0 in a number of countries, including the Netherlands. And then you see exactly the problem I outlined above. Those figures are based on the number of people infected. So, if we start testing significantly more in the coming month, we will find more infected people and R0 will go up in this overview.
We regularly hear that “the R0 goes back to 1”, or even “that it’s passing it”. But realize that that R0 can be lower or higher at that moment. (The continuing decline of all key figures since the beginning of April suggests that over that period, we must certainly have been well below 1).
Too few specifications in the numbers
But even if we had the perfect insight into the number of infected persons or hospital admissions or deaths, that wouldn’t mean anything to the policy if we didn’t specify it better.
Let’s assume that, thanks to the lock down in society, no one is infected anymore. But that there were still major outbreaks in care institutions. Then the key figures would indicate large numbers of victims, while there is nothing going on anymore outside these health care institutions.
Policy would then be determined by the overall figures, because we have no other choice. And that would lead to decisions with major consequences for the economy and society.
Imagine that the figures do indeed rise. Is it because the schools have opened, the contact professions have become active again, we go outside more, the swimming pools are open or because there are new developments in the meat industry?
Spoiler alert: we don’t know because we do not have the data!
And so we run the risk, that if the increase is only due to the swimming pools (which I don’t think), the consequence will be that we will reverse the whole package of measures.
And it could easily have been different. If we had just taken a questionnaire from every infected person, including questions that can be used to determine what caused the infection. Then we would be able to follow the spread of the virus over time. And we could see the pattern changing per day with every new case. (Which is quite simple to do. I have been using NoTies software for almost 20 years. Usage costs are very low and it can be used on any device.
But it just seems that people don’t realize how important it is to collect data in order to have the best possible policy.
Crash the Curve, impossible in the Netherlands
There are several experts who say on TV that it is better to stay in lock down for a while longer to minimize the number of infected people. Because if we only open up after that, then we can keep things well under control by means of a targeted policy on the people who are still infected.
May I help those who suggest that to wake up? The way in which we organize contact research and set up and maintain quarantines in the Netherlands, would lead to laughter in South Korea. Just follow the discussions in the media about organizing the contact investigation. National newscast News has devoted several reports to it. This was the most recent, more than 2 months after the start of the pandemic.
And if we are not perfectly able to investigate new cases and to warn and control all their contacts, the numbers will rise again.
Meanwhile, Crash the Curve is also Crash the Economy (if it hasn’t already happened anyway).
We are neither trained, nor prepared, to keep the number of new cases close to zero.
The latest big bad wolf: the second wave
It’s really laughable if it wasn’t so sad. Recognize the drastic measures based on unreliable figures and the colossal consequences they have.
I am convinced that when our governments’ measures are evaluated in a couple of years, conclusions will be that they promoted total panic worldwide, based on a primary fear of death. That fear is understandable for an average citizen, but not for policymakers and their advisors.
Take the threats of “the second wave”. Using that term gives the feeling that if the number of cases rises again, we will end up in the “Bergamo scenario” again. The ICU’s can’t handle it anymore. The dead pile up in the corridors.
A we have to prevent that as much as possible, let’s maintain the lock down for a few weeks (preferably months).
First of all, I have already shown that the R0 is not a hard figure. And that rises can also be related to special circumstances in a certain place, or in a certain sector.
In addition, the number of ICU admissions (if that is the indicator) is now around 10 per day. At the end of March this was well over 100 per day.
So, if in autumn the numbers were to rise a bit, it will not see that high Bergamo level by a long shot. The simple fact that we have banned (super spread) events in the Netherlands, implies that the figures can only be as high as I show in a graph below.
The yellow line concerns the development in 5 municipalities BEFORE THE LOCK DOWN. In those municipalities no super-spreading events were held (as in the municipalities with a blue line). Two groups of municipalities with the same number of inhabitants (150,000).
So, in a period of 12 days (between March 10 and March 22), while doing everything that was forbidden by Prime Minister Rutte after March 15, the increase in the number of sick people was very clear (a doubling).
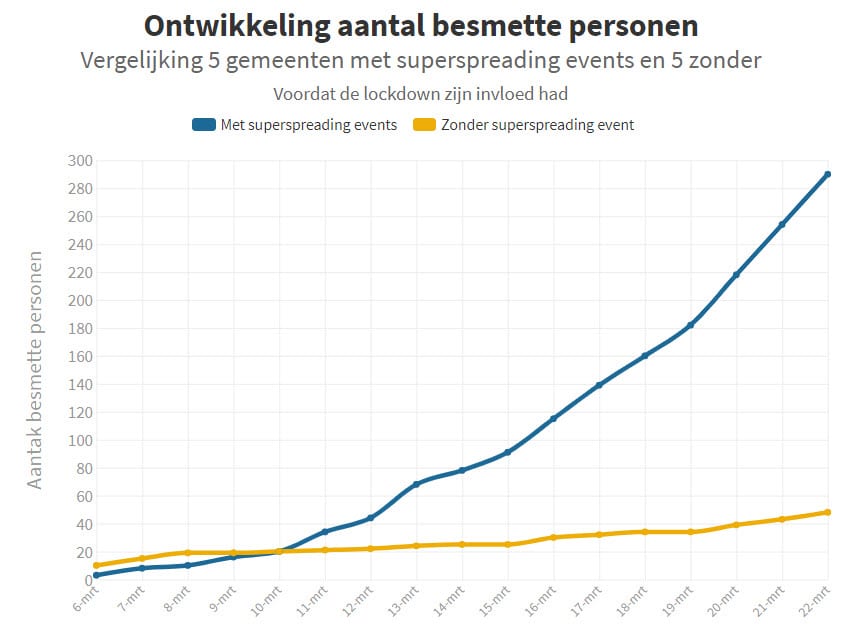
I repeat: that was when we were living our normal life’s. No social distancing, no restaurants and cafes that were closed and with people still working at the location of their company.
There could indeed be a somewhat larger increase in new cases in the autumn, but only if we have not learned anything this summer and if governments still pursue a policy that is not based on data. And don’t try to gather data through all kinds of targeted tests, as explained below.
As contamination only becomes noticeable after five days, the results until March 21 relate to the situation before the announcement of the lockdown measures. Between March 6 and March 21 (average), there was therefore an increase of factor 6. In places with a super-spreading event this was a factor of 50.
We do not know exactly how and where the distribution takes place. This means that some of the measures are effective and some unnecessary. Because even without these measures, there would be no or very few infections. For example, there is a lot of research material available that shows that people outside (and certainly during the day with sun) are hardly infected or not at all. However, many outdoor activities are prohibited.
If this is unnecessary, it causes both economic damage and damage to joie de vivre. Imagine that a day at the beach (even without distance) does not lead to more infections. Or sit close together on the terrace, or an outdoor youth festival. Then it is very counterproductive if they are (and remain) prohibited?
In view of the experiences of the past few months, it can be expected that a wide range of situations, including indoors, will not lead to (many) infections. But those are also prohibited.
Certainly, if it is suspected that the virus will spread again in the autumn, it is important to know where the risks are and which are not.
And therefore, the slogan “test, test, test”.
The following test situation needs to be created quickly and on a large scale, where we quickly identify what may or may not be an outbreak risk and what is not a real risk. The approach is described on the basis of one example, but can apply to all kinds of situations.
We will examine whether or not new infections with young people under the age of 30 arise during an outdoor festival.
For example, a maximum of 500 young people may come. They know in advance exactly what will happen and why. They sign an “agreement” with which they undertake to complete an online questionnaire about how they feel after the event three times (after five, eight and fifteen days). They also agree to quarantine any complaints (which typically become noticeable after five days).
The questionnaire asks whether or not symptoms have occurred. If there is an affirmative answer, a test call will be used to determine whether there is a COVID-19 infection. It would then be known within ten days whether or not the event led to new infections.
Obviously, at-risk groups (people over the age of 50) should not participate in such a test, because it is about whether one infects each other, not how sick one gets.
Many variants are possible, both in terms of location and precaution (with or without mouth protection, only outside or also inside with ventilation). There are also all kinds of options about the number of people present and the circumstances: whether or not they are 1.5 meters away, or increasing numbers of people present. The tests can take place in stadiums, at events, along sports fields, in theaters, in cinemas, on terraces, on the beach, in restaurants, in gyms, et cetera.
With a quick and good set-up, this could be started up within two weeks. The experiment is registered and approved centrally. Those involved will be given the tools to perform the test correctly: test design, agreement and software for administering the questionnaire, which has been used for many years for all kinds of online panels / polls. This software also ensures that the results are received centrally per experiment, so that it quickly becomes clear what does and does not lead to problems.
This could just lead to football matches being played in a half-full stadium. That theater performances in full halls are possible and that certain events can take place without any problems. Imagine that it is established that sitting outside in the sun (even without a 1.5 meter distance) does not lead to additional infections … That is very valuable now that summer is coming!
If we don’t start soon, we actually learn little about how the virus behaves. If we continue to take measures that are not necessary, this will cause damage in many ways. Both economically and socially.
The method of testing described above should be indispensable for the Dutch government, Dutch society and Dutch companies in tackling COVID-19 and minimizing the damage to society. A crucial component of the smart exit strategy.
So, realize, that every time we hear an expert in the media threatening with “the second wave” that it is mainly fear mongering. And not based on the evaluation of data. A continuation of the pattern that I’ve been observing for 2 months now, in which people say all kinds of things, without having a numerical basis/proof for it. With the additional fact, that it seems that in those two months hardly any more attempts have been made to collect the data.
The second wave
There have been interventions by the authorities, which we couldn’t have imagined until three months ago. However, they have intervened on the basis of very shaky data. And this in cooperation with professionals, who very often use the word “evidence-based”. And the sad thing is, most politicians as well as the media seem to hang on the lips of these experts.
A few examples:
The vague reproduction factors
The so crucial reproduction factor (R0) is not a God given formula that you can apply just like that. Choices have to be made when defining R0. The choices you make influence the outcome.
If you know exactly how many infected people there are per day in the Netherlands, you can easily calculate that figure. But we do not have these figures (which are impossible to obtain). Th amount of testing only provides a small part of them. In the absence of that data, you have to approach it via other methods. But because of that, the R0 is only an indication of what is really happening with the spread of the virus in the population:
· The Corona mortality rates used by the RIVM are based on the mortality of people who had been diagnosed of having Corona. Based on the population registrar, Statistics Netherlands (CBS) determents how many more Dutch people die each week, than the average for that week in recent years. Anything more is called excess mortality and is then assigned to this virus. The CBS count is 2 weeks behind on average. If we then know that on average it takes 3 weeks between becoming infected and dying, the total delay is 5 weeks.
· Assuming the number of people actually found to be infected in the Netherlands (currently more than 45,000), the number found depends entirely on how many people have been tested. If we are going to double the number of tests in the near future, you will find more infected persons.
· If you base yourself on daily hospital admissions, which the RIVM apparently does, then these is another problem: It could well be that, because hospitals are less crowded now, they are less strict when accepting patients. That would mean an increase in the number of hospitalizations without the number of infections in the country increasing.
So, the data is just an approximation of reality with considerable margins of uncertainty.
This was the last presentation of the R0 figure by the RIVM at the session with the Lower House on May 7th.

So, on May 7th the R0 was presented based on the hospital admissions until May 1st. Hospital admissions will take place 10 to 12 days after the infection. So on average there is already a delay of 3 weeks.
To add insult to injury: The RIVM refuses to disclose which values they use in the R0 formula. Plus, they don’t want to disclose what the current values are, as this tweet from a journalist shows:
So, we can’t check how the figure is calculated, and we don’t get to hear the actual values.
A number of German universities show on their website the development of R0 in a number of countries, including the Netherlands. And then you see exactly the problem I outlined above. Those figures are based on the number of people infected. So, if we start testing significantly more in the coming month, we will find more infected people and R0 will go up in this overview.
We regularly hear that “the R0 goes back to 1”, or even “that it’s passing it”. But realize that that R0 can be lower or higher at that moment. (The continuing decline of all key figures since the beginning of April suggests that over that period, we must certainly have been well below 1).
Too few specifications in the numbers
But even if we had the perfect insight into the number of infected persons or hospital admissions or deaths, that wouldn’t mean anything to the policy if we didn’t specify it better.
Let’s assume that, thanks to the lock down in society, no one is infected anymore. But that there were still major outbreaks in care institutions. Then the key figures would indicate large numbers of victims, while there is nothing going on anymore outside these health care institutions.
Policy would then be determined by the overall figures, because we have no other choice. And that would lead to decisions with major consequences for the economy and society.
Imagine that the figures do indeed rise. Is it because the schools have opened, the contact professions have become active again, we go outside more, the swimming pools are open or because there are new developments in the meat industry?
Spoiler alert: we don’t know because we do not have the data!
And so we run the risk, that if the increase is only due to the swimming pools (which I don’t think), the consequence will be that we will reverse the whole package of measures.
And it could easily have been different. If we had just taken a questionnaire from every infected person, including questions that can be used to determine what caused the infection. Then we would be able to follow the spread of the virus over time. And we could see the pattern changing per day with every new case. (Which is quite simple to do. I have been using NoTies software for almost 20 years. Usage costs are very low and it can be used on any device.
But it just seems that people don’t realize how important it is to collect data in order to have the best possible policy.
Crash the Curve, impossible in the Netherlands
There are several experts who say on TV that it is better to stay in lock down for a while longer to minimize the number of infected people. Because if we only open up after that, then we can keep things well under control by means of a targeted policy on the people who are still infected.
May I help those who suggest that to wake up? The way in which we organize contact research and set up and maintain quarantines in the Netherlands, would lead to laughter in South Korea. Just follow the discussions in the media about organizing the contact investigation. National newscast News has devoted several reports to it. This was the most recent, more than 2 months after the start of the pandemic.
And if we are not perfectly able to investigate new cases and to warn and control all their contacts, the numbers will rise again.
Meanwhile, Crash the Curve is also Crash the Economy (if it hasn’t already happened anyway).
We are neither trained, nor prepared, to keep the number of new cases close to zero.
The latest big bad wolf: the second wave
It’s really laughable if it wasn’t so sad. Recognize the drastic measures based on unreliable figures and the colossal consequences they have.
I am convinced that when our governments’ measures are evaluated in a couple of years, conclusions will be that they promoted total panic worldwide, based on a primary fear of death. That fear is understandable for an average citizen, but not for policymakers and their advisors.
Take the threats of “the second wave”. Using that term gives the feeling that if the number of cases rises again, we will end up in the “Bergamo scenario” again. The ICU’s can’t handle it anymore. The dead pile up in the corridors.
A we have to prevent that as much as possible, let’s maintain the lock down for a few weeks (preferably months).
First of all, I have already shown that the R0 is not a hard figure. And that rises can also be related to special circumstances in a certain place, or in a certain sector.
In addition, the number of ICU admissions (if that is the indicator) is now around 10 per day. At the end of March this was well over 100 per day.
So, if in autumn the numbers were to rise a bit, it will not see that high Bergamo level by a long shot. The simple fact that we have banned (super spread) events in the Netherlands, implies that the figures can only be as high as I show in a graph below.
The yellow line concerns the development in 5 municipalities BEFORE THE LOCK DOWN. In those municipalities no super spreading events were held (as in the municipalities with a blue line). Two groups of municipalities with the same number of inhabitants (150,000).
So, in a period of 12 days (between March 10 and March 22), while doing everything that was forbidden by Prime Minister Rutte after March 15, the increase in the number of sick people was very clear (a doubling).
Some received answers and remarks
1. Lie
8 may 2020 op 21:17
In North America we have quite a few super-spread events at worksites especially the meat industry, I’m quite familiar with the PPE the staff wears normally on the work floor already per regular hygienic regulations before COVID came in the picture (gloves and face covering at the large facilities are standard),however the staff does work in close proximity to each other. I’m quite interested to hear your opinion as where you think most likely the transfer of the infection would be taking place, during breaks or on the work floor.
2. Maurice
8 may 2020 op 22:13
I wrote a blog about it already.
3. Maurice van Ulden
9 may 2020 op 12:19
Dear mister and other readers,
It’s fantastic that new knowledge could lead to get in control of the coronavirus that causes COVID-19. But reducing the spread significantly seems to be difficult. On the 8th of may I read in an article in a Belgium newspaper (demorgen) that blood research on antibodies suggests that the spreading of the coronavirus seems to seriously continue even in the lockdown, Possibly with a speed of more than 1% of the population per week.
Absolutely mind-boggling news came to me when seeing a vlog on YouTube made by Dr Campbell on the 5th of may: the first retrospective study which determines the association of Vitamin D status and COVID-19 mortality outcome. Result: Chances to die from COVID-19 seems to be 10 times higher (!) with a Vitamin D insufficiency.
How come that in Belgium, and probably is many countries, less and less people become seriously ill while the virus still seems to be spreading? Rising vitamin D levels due to increasing sunlight intensity? …
But in for instance in sunny Brazil there was an outbreak as well? There is a lot of sun there? Research seems to show that there are vitamin D insufficiencies in Brazil as well…
Maybe restoring vitamin D levels would be one of the most important parts of a strategy to cope with the Sars-CoV-2 coronavirus.
Thank you.
Dr Campbel on Vitamin D:
The vitamin D study:
https://papers.ssrn.com/sol3/papers.cfm?abstractid=3585561#.Xq
Vitamin D insufficiency in Brazil:
https://www.ncbi.nlm.nih.gov/pubmed/29420062
4. Hans
10 may 2020 op 15:35
1) Transmitting an infection with Covid-19 by touching objects does not happen. I repeat: does not take place.
2) Everything we do to prevent contamination by touching objects is of no value.
Erin Bromage – Associate Professor of Biology at the University of Massachusetts Dartmouth.
“While I have focused on respiratory exposure here, please don’t forget surfaces. Those infected respiratory droplets land somewhere. Wash your hands often and stop touching your face!”
Dr. Bromage graduated from the School of Veterinary and Biomedical Sciences James Cook University, Australia where his research focused on the epidemiology of, and immunity to, infectious disease in animals. His Post-Doctoral training was at the College of William and Mary, Virginia Institute of Marine Science in the Comparative Immunology Laboratory of late Dr. Stephen Kaattari. Dr. Bromage’s research focuses on the evolution of the immune system, the immunological mechanisms responsible for protection from infectious disease, and the design and use of vaccines to control infectious disease in animals. He also focuses on designing diagnostic tools to detect biological and chemical threats in the environment in real-time
Dr. Bromage joined the Faculty of the University of Massachusetts Dartmouth in 2007 where he teaches courses in Immunology and Infectious disease, including a course this semester on the Ecology of Infectious Disease which focused on the emerging SARS-CoV2 outbreak in China.
See https://www.erinbromage.com/post/the-risks-know-them-avoid-them
5. Edwin IJpeij
10 may 2020 op 17:30
Off topic but interesting research results from Kessel: many people there have antibodies against covid-19. Read also the last paragraph: https://www.1limburg.nl/veel-kesselnaren-bezitten-antistoffen-tegen-coronavirus?context=topstory
6. Robbie K
11 may 2020 op 10:46
it makes sense to listen to the Chinese on SARS-CoV-2 because they have experience.
Prof from Tongji University:
– Home quarantine doesn’t work. 83% of those who got sick in China were infected from in the home by relatives. A better practice would be to stay in a converted temporary quarantine shelter until you’re better.
– Everyone needs to wear a mask. And especially inside buildings.
– Windows need to be opened in buildings (but many US buildings don’t have operable windows).
– Toilets play a big role. Field measurements in Wuhan have shown that airborne coronavirus concentration is highest in the bathrooms (both public bathrooms in a mobile cabin hospital and in ICU private bathrooms), so the recommendation is to use a private toilet and to limit the usage of public toilets to the public.
– Unhealthy individuals need to be kept out of buildings. how can we do this? It’s important to check temperatures. Granted younger people don’t often present with elevated temperatures, but this could keep at least 50% of unhealthy people out of buildings where transmission is more likely to occur. Also, it would be good to have a way to check whether the person has been exposed – contact tracing would do this, maybe with an app.
– Fan filter units, such as a HEPA recirculating portable air cleaner, are important to use in high risk or high-profile areas such as crucial offices. They must be sized appropriately.
In buildings, turn off the return fan, or use a MERV 16 or higher in the return.
– Note that 3,062 doctors and nurses were infected in Wuhan. However, most of them were from local hospitals because they did not have adequate PPE at the beginning. During the outbreak an additional 42,600 doctors and nurses were sent from other provinces to help Wuhan, and none of them got infected because of the excellent PPE they were wearing.
– Where are you take off your PPE and how is important. This activity has a very high rate of virus shedding so spray the PPE switch alcohol before taking them off.
7. Robbert
11 may 2020 op 14:46
Related to the circulation of fresh air in public buildings, offices etc. In most buildings the air is not circulated but. A separate inlet and outlet exist. But the air which comes in in an office or room passes other rooms and might transport aerosols. Open windows of other ways of ventilation is not provided and cannot me made according to landlords. I think it needs attention related to the governmental rules for Covid-19
Stay safe and in good health, let’s see what the near future will bring to us.